Book Recommendations
While I'm always a huge advocate for hands-on practice when it comes to your journey to become a Data Analyst, you do have to know the theory behind the best practices for data analytics. Here are some of the books I find myself recommending time and time again, to help you become the best data analyst you can be.
Try to find these for free at your local library, or I've included Amazon links to all, note that as an Amazon associate, I can earn a commission from purchases made using the links below.
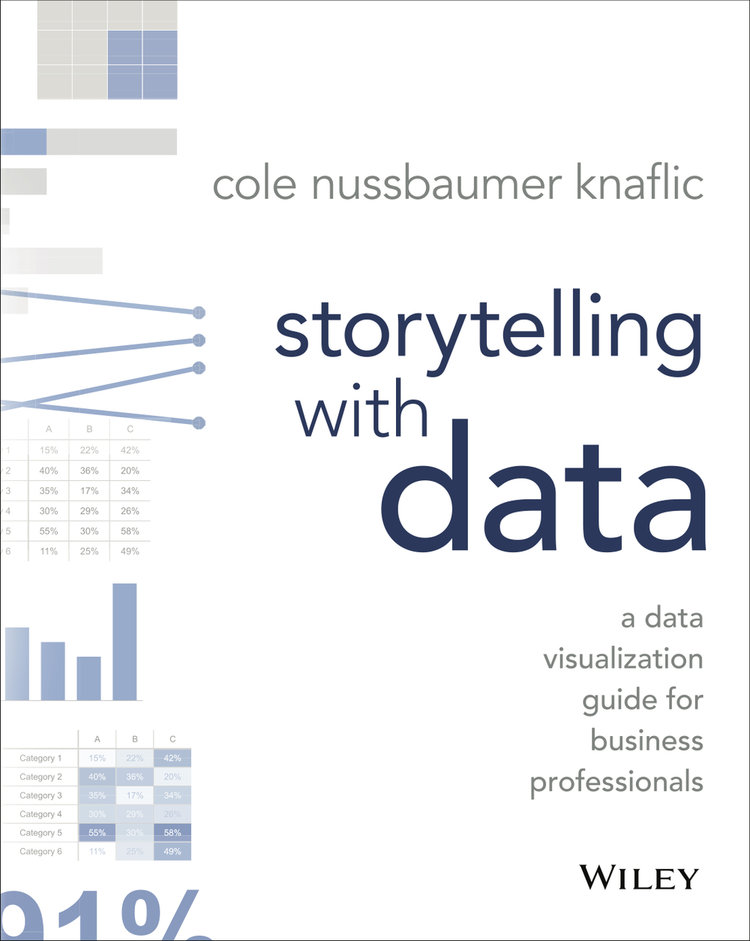
Storytelling With Data - I recommend this to anyone working with data. Whether you are a professional or just starting your Analytics journey, this book will improve your reporting and presenting skills. And most importantly, it will teach you how to pick effective visuals for your data and the best way to format them.
Storytelling with Data: Let's Practice - The sequel to 'Storytelling with data', It offers hands-on exercises and challenges designed to reinforce the concepts and techniques discussed in the original book. With a focus on improving data communication skills, this workbook provides readers with ample opportunities to practice creating clear, engaging, and persuasive data visualizations that effectively convey insights and tell compelling stories.
How Charts Lie - This book explores the common pitfalls and misconceptions associated with data visualization. It shows how charts can be manipulated to deceive or misinform readers. The book provides practical examples and tips to help readers become more aware of these manipulations and make better-informed interpretations of visual data. Learning how charts can be deceiving will help you make sure you are always making truthful charts that tell the whole story you want to communicate. The Big Book of Dashboards - is a comprehensive guide that focuses on designing effective and impactful dashboards. The book offers a wealth of practical insights, best practices, and real-world examples to help readers create visually compelling and data-driven dashboards. With a strong emphasis on usability and user experience, it provides guidance on selecting the right visual elements, organizing data effectively, and telling a compelling story through interactive dashboards.
 The Big Book of Dashboards - is a comprehensive guide that focuses on designing effective and impactful dashboards. The book offers a wealth of practical insights, best practices, and real-world examples to help readers create visually compelling and data-driven dashboards. With a strong emphasis on usability and user experience, it provides guidance on selecting the right visual elements, organizing data effectively, and telling a compelling story through interactive dashboards.

